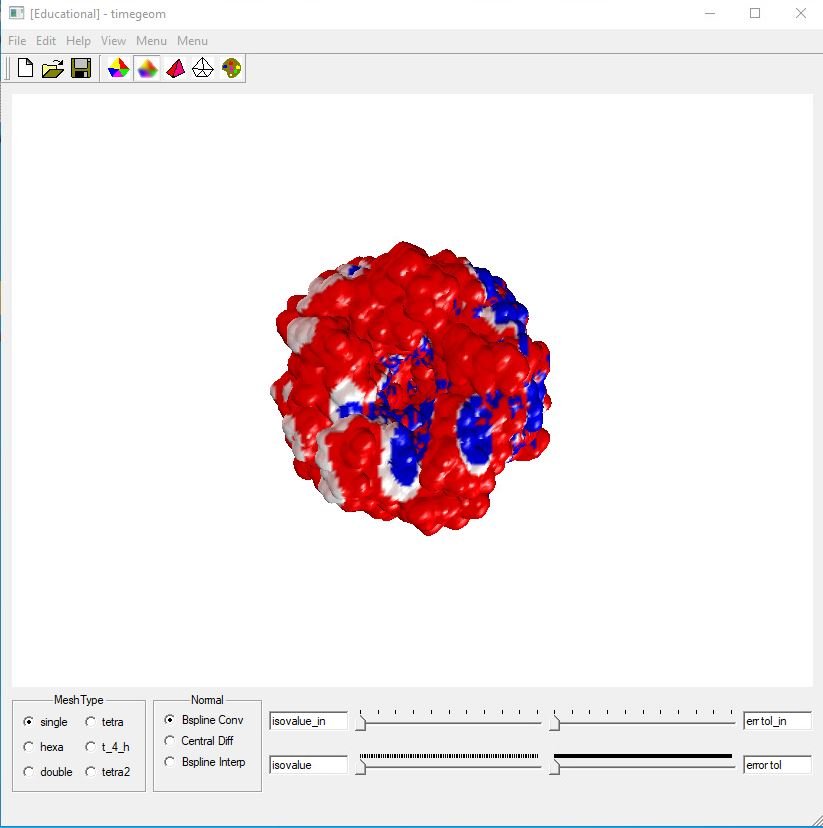
It calculates the electron static potential value for each vertex on the isosurface by constructing a trilinear function f(u, v, w), where 0 ≤ u, v, w ≤ 1. Print out the maximum, minimum, and mean value of the potential values on the solvent accessible surface, and write triangular mesh in *_tri.rawc format. The color map is > 0.1 – blue, < -0.1 – red, [-0.1, 0.1] – white.


